Capacity & Scaling Model
Flexible scalable crochet kit manufacturing capacity designed for predictable production output, peak season response, and multi-SKU growth across multiple manufacturing sites.

Base = 50K/month steady-state. Surge = +75K/month (activation in 7–14 days). Strategic reserve = optional capacity for emergencies or major opportunities (mobilization in 21–30 days). Maximum monthly output varies by SKU complexity, component count, and packaging scope.
Why This Scaling Model Matters
This is not just about production volume. It is about giving brands predictable manufacturing, controlled scaling, and reduced operational risk when demand grows.
Avoid Stockouts
Pre-allocated base capacity and surge tiers help reduce the risk of running out of stock during peak demand windows.
Handle Growth
The model supports scaling from initial launch to broader multi-SKU expansion without breaking production flow.
Stabilize Delivery
Defined production tiers improve lead time predictability and make shipment planning more reliable.
Reduce Risk
Multi-site architecture and reserve capacity reduce exposure to supply shocks, logistics delays, and sudden demand spikes.
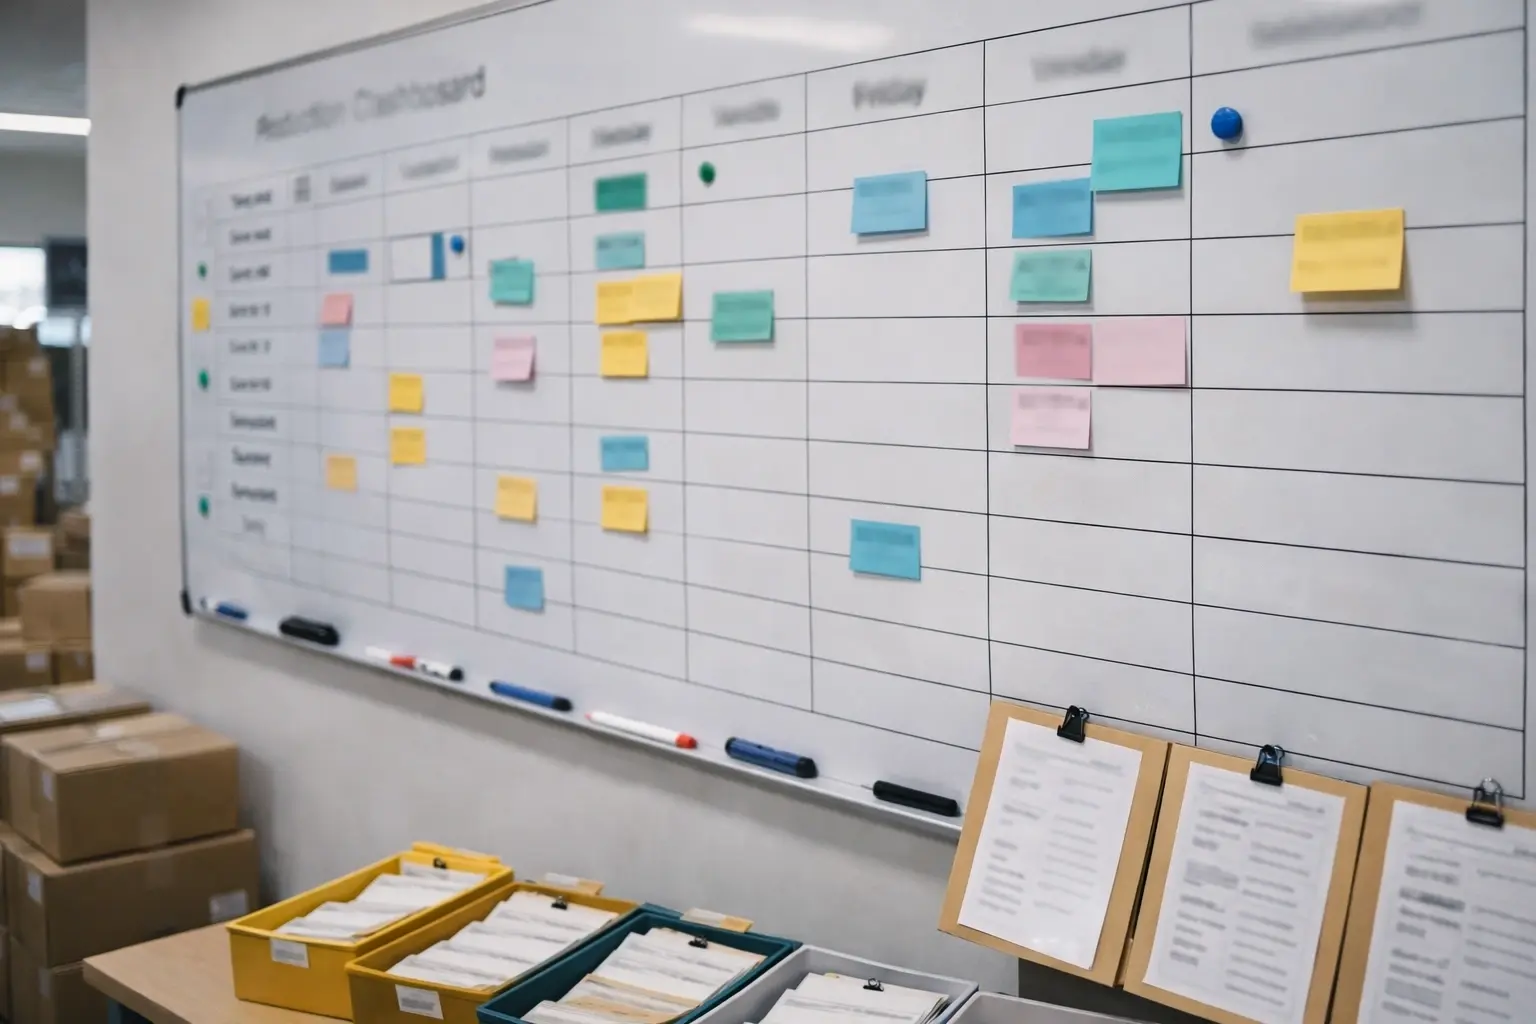
Multi-Tier Production Model
Structured production capacity planning across base operations, surge response, and strategic reserves for predictable scaling and better risk control.

Base Capacity
50,000 units/month steady-state production
Designed for stable, repeatable output with consistent QA gates and more predictable lead times.
This means for your business: stable baseline production without relying on emergency ramp-ups for routine orders.

Surge Capacity
+75,000 units/month peak response
Pre-planned flex sites and on-call staffing enable rapid ramp within a defined activation window.
This means for your business: you can support launch spikes, retail programs, and peak season demand with better confidence.

Strategic Reserve
Emergency & opportunity response tier
Used for supply chain disruptions, urgent launches, or unexpectedly large wins. Mobilization is gated to protect base quality and committed schedules.
This means for your business: you have a controlled fallback option instead of scrambling when market conditions change.
Annual Capacity Model
Illustrative monthly pattern showing capacity availability vs demand. Actual production outcomes vary by SKU complexity, component count, assembly steps, and packaging or labeling scope.
Monthly chart: Demand increases from January through October, then reduces toward December. Capacity is shown as a higher baseline band above demand most months.

Planning accuracy improves when forecast, SKU complexity, and packaging scope are locked early. We recommend confirming a 12-week rolling plan before entering high-demand windows.
View chart data (illustrative)
| Month | Demand (relative) | Notes |
|---|---|---|
| Jan | 60% | Post-holiday normalization |
| Feb | 65% | Planning & replenishment |
| Mar | 70% | New product prep ramps |
| Apr | 75% | Mid-season steady growth |
| May | 80% | Campaign lead-in |
| Jun | 85% | Summer peak preparation |
| Jul | 90% | Back-to-school begins |
| Aug | 95% | Launch & replenishment |
| Sep | 100% | High demand window |
| Oct | 100% | Holiday build-up |
| Nov | 90% | Fulfillment & late campaigns |
| Dec | 80% | Wind-down & transition |
Definitions & methodology (how we measure) Click to expand

Peak Season Response
Systematic approach to managing seasonal demand spikes with predictable scaling, stable execution, and more consistent quality across all production tiers.
90-Day Peak Season Preparation
Planning Phase
- Demand forecasting & capacity allocation
- Material pre-ordering & inventory build-up
- Artisan training & skill certification
- Quality gates & scaling checks
Activation Phase
- Surge site activation & staffing plan
- On-call mobilization & cross-training
- Production line balancing
- Packaging and logistics scaling
Execution Phase
- Full tiered production mode
- Real-time demand & WIP monitoring
- Daily QA checks & corrective actions
- Expedited shipping coordination
Historical Peak Performance
KPIs are tracked against defined QA gates and agreed delivery definitions documented per project.
Operating Principles
Plan Your Peak Season Success
Partner with U-My for more predictable scaling and reliable peak season performance. Our structured approach helps you ship on time with better operational control.
Typical response within 24 hours. NDA available upon request.
Why Our Scaling Model Works
A systematic approach to capacity management helps deliver more predictable outcomes for brands that need reliable scaling and consistent quality.
Predictable Scaling
Defined production tiers with activation timelines reduce uncertainty in planning and delivery commitments.

Quality Consistency
Standardized training, documented work instructions, and unified QA gates help maintain stable output across all sites.

Risk Management
Multi-site design with reserve options reduces exposure to supply shocks, logistics congestion, and sudden demand changes.
Scaling Playbook
Clear inputs from your team enable faster, more reliable capacity allocation and a documented execution plan.

Client Inputs
-
12-week rolling forecastMonthly split, target ship window, and campaign milestones if available.
-
SKU complexity snapshotComponent count, size variants, accessories, and critical-to-quality points.
-
Packaging & labeling requirementsBox style, inserts, multilingual content, and compliance labeling needs.
-
Quality agreement expectationsInspection plan, test requirements, and acceptance criteria.
Our Commitments
-
Capacity allocation & ramp planTier selection, activation timeline, and site allocation strategy.
-
Milestones & critical pathPre-production approvals, material lock, packaging sign-off, and production start.
-
Risk register & mitigation actionsTop risks by category with preventive measures and escalation triggers.
-
Reporting cadenceWIP tracking, QA summaries, and shipment readiness updates.
How We Keep Quality Stable Across Sites
Scaling does not need to mean higher variability. Cross-site controls help support repeatable output and more consistent acceptance results.

Component lists, substitutions, and approved suppliers are controlled and documented.
Pattern and instruction versions are managed with change control and approval gates.
Reference samples guide training, in-process decisions, and final acceptance alignment.
Incoming, in-process, and final checks with batch traceability and escalation triggers.
Risk Mitigation Matrix
Practical contingency planning for the most common peak-season disruptions in scalable manufacturing.

| Risk | Signal / Trigger | Mitigation | Escalation |
|---|---|---|---|
| Material delay | Supplier lead time slips; inbound variance | Buffer inventory, supplier redundancy, pre-lock key materials | Switch supplier or approve substitution with controlled change |
| Yield/quality drift | Defect trend breaches threshold at QA gate | Golden sample refresh, retraining, process checklists, extra sampling | Stop-ship for affected lot; corrective action plan within 24–48h |
| Logistics congestion | Carrier space shortage; transit volatility | Pre-booking, alternative routing, staged shipments | Escalate shipping mode or timing; prioritize critical SKUs |
| Demand spike | Forecast uplift; campaign pull-forward | Activate surge tier, rebalance lines, adjust allocation | Enable reserve tier if needed; formalize revised ship plan |